Global private debt has been in the spotlight over the past 12 months, as fund managers and asset allocators navigate the impact of artificial intelligence (AI) disruption on the ‘tech heavy’ sector and the spectre of rising defaults. Despite the negative publicity, the underlying credit fundamentals of the sector are remarkably healthy with little deviation from historical averages.
However, investor behaviour in the US retail market has been unstable and is showing signs of stress and elevated levels of redemption activity. The divergence between the performance of the sector and market sentiment presents a challenging dichotomy, and in many respects, the risk is akin to the Thomas Theorem of 1928, where if investors define a situation as real, it becomes real in its consequences. If anything, the market environment is a reminder of the importance of education, ensuring that investors access the asset class with the right time horizon, and acceptance that capital is accessible on a restricted basis.
In this piece, we perform a health check of the sector – to identify trends in credit performance, defaults and loss rates, potential early signs of borrower stress and also explore the risk of gating. Creating a hypothetical PE backed company operating in an AI disrupted sector, we model the amount of EBITDA decline required before a borrower would struggle to meet its loan obligations and the toolkit used by lenders to manage such scenarios.
What is global private debt?
Private debt is relatively simple; a lender provides a loan to a company, which can be either sponsored (or backed) by private equity (PE) or directly negotiated on a bilateral basis. Funding is used for a range of purposes including business operations, construction projects or to finance merger and acquisition (M&A) activity. Additionally, loans can be extended to refinance existing debt obligations or optimise a company’s debt/equity structure via dividend recapitalisations.
When a loan is funded, the lender negotiates an original issue discount (OID) or upfront fee with the borrower, with the lender only providing approximately 98c in the dollar, with the borrower repaying the full amount at the agreed maturity date.
Over the life of the loan, the borrower makes interest repayments, typically expressed as a spread above the SOFR rate (for US borrowers) and at maturity, repays the loan. Depending on the borrower’s risk profile, seniority level and tenor, the spread over the risk-free rate is typically 4% p.a. to 5.5% p.a.
Health of the direct lending market
The US direct lending market continues to perform soundly, displaying low default rates with non-accruals (i.e. borrowers not meeting repayment obligations after 90 days) hovering around 2.2%, which is consistent with long-term averages and below the levels observed in public high yield markets. In 2025, high yield corporate defaults were 3.1% (i.e. issuers rated BB+ rated by Standard and Poors and below), which is in line with the 10-year S&P average.
Following our most recent review, Zenith rated managers had non-accruals of less than 3% of net asset value (NAV). Further, PIK (i.e. payment in kind interest) exposures, where coupon or interest payments are capitalised on a loan balance, were generally less than 10%. If we separate between good and bad PIK, with the latter referring to borrowers switching from ‘cash paid’ interest to capitalising payments due to liquidity and cashflow problems, the figure was closer to 5%.
In terms of forward-looking stresses, we haven’t observed any systemic deterioration of credit metrics across portfolios, with asset-weighted interest coverage and net leverage levels stable around 2x and 5x to 6x, respectively. In addition, the liquidity of borrowers remains healthy, with plenty of liquidity headroom and undrawn revolving credit facilities (RCFs), to support future growth initiatives.
AI disruption
The asset class has a high exposure to the software and SaaS sector, which is not unexpected, given these companies typically exhibit defensive earnings streams with high contractual and recurring revenues – both of which are attributes highly prioritised by the private equity (PE) sector.
SaaS exposure varies significantly across managers, with some more exposed to AI enablers, infrastructure and tool providers, while others to companies that deliver AI‑enabled enterprise solutions, such as embedding AI into workflows to automate processes and capture efficiency gains. Borrowers most at risk have relatively weak moats around their earnings and typically relied on labour-scaled models.
AI disruption risk is in the first instance a problem for equity investors or the PE sponsor who is directly exposed to revenue and EBITDA declines. Senior secured lenders are protected by equity cushions of between 40% and 60%, which act as the ‘first loss’ piece and a buffer. To illustrate the EBITDA decline required to impact a senior lender, we’ve created a hypothetical capital structure of a SaaS company, with a financial and leverage profile consistent with a PE sponsored company.
Hypothetically speaking
A SaaS business produces low value-add content creation and marketing tools that are at risk to generative AI. The current leverage of the business is 6x (net debt / EBITDA), with net interest coverage of 2.2x and an equity cushion of 60%. A traditional term loan debt facility applies, with three years to maturity and paying SOFR plus 4.0%.
The following table highlights the EBITDA decline required over a 12-month period for a borrower to be unable to meet its interest obligations on its outstanding debt, assuming borrowing rates remain unchanged.
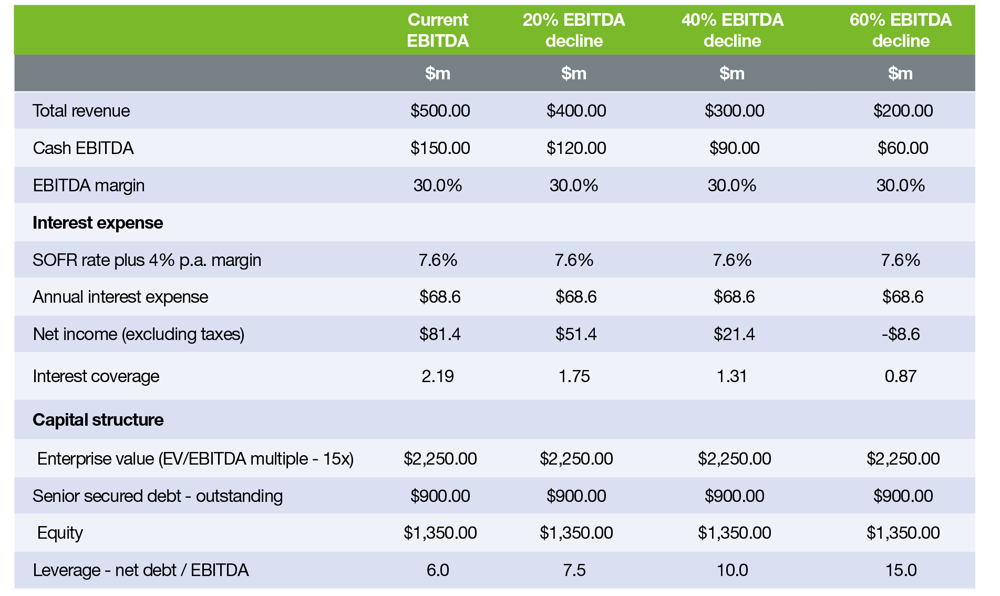
Source: Zenith Investment Partners
The SaaS firm has to suffer an EBITDA decline of approximately 60% before interest coverage falls below one and it can no longer meet its payment obligations. While we’ve presented a simplified case study, in a practical context, declines of this magnitude typically occur over multi-year periods, creating ample runway for lenders to actively manage exposures.
The toolkit for managing impaired loans is broad and includes loan amendments, waivers, maturity extensions and requirements for additional equity injections. Provided that loan documentation is tightly negotiated and includes negative covenants, leverage tests and restrictions on asset leakage, the lender often has control of the situation, well before any signs of payment stress.
What’s often under-recognised is the role of the senior lender in managing loan positions as part of its day-to-day operations. Through monthly monitoring of cashflow statements and regular discussions with senior management, lenders have high visibility on potential credit events, often years in advance of technical defaults.
Is the gating risk real?
Over the past few months, there‘s been ongoing media coverage of rising redemptions in the US BDC sector and the potential spillover effects to the Australian market, given most of the funds on our APL invest directly in US master vehicles.
The best proxy for redemption activity in the US private debt sector is the non-traded US BDC market, which is required to publicly disclose redemption requests as a percentage of NAV (i.e. capped at 5% of NAV). The following chart plots the redemption requests for Q3 to Q4 2025, noting that Q1 2026 data is not currently available.
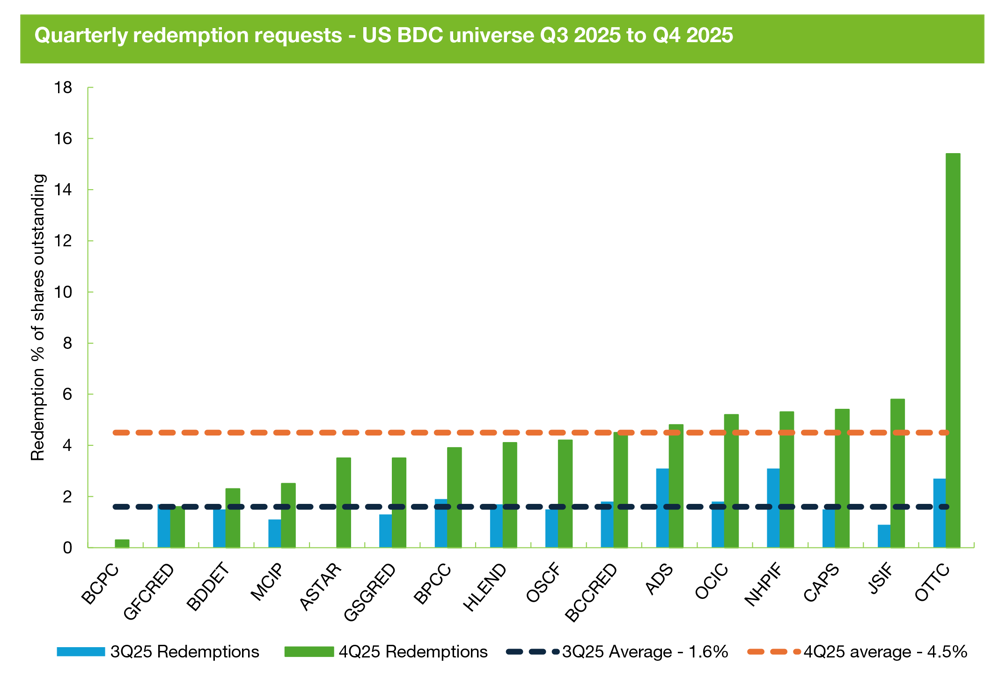
Source: Fitch Ratings, company reports
Redemption requests have drifted higher, albeit below the 5% quarterly threshold which is common across the BDC market. For example, from Q3 to Q4 2025, average tender offers increased from 1.6% to 4.5%. The only BDC with a material tick-up was a specialist tech lending vehicle, which received 15% redemption requests, all of which were satisfied in full.
Based on early indications, the Q1 2026 tender offer period is expected to show a continuation of the rising redemption trend, albeit this will vary across managers. Managers scaling redemption requests at the BDC level is expected and importantly, provides a safeguard for protecting the interests of remaining investors. While scaling back announcements are generally reported with negative connotations, in practice, these funds are being managed exactly in accordance with how they have been designed.
It’s difficult to forecast the spillover effects to the Australian market, given the global investor base, use of master/feeder structures and the role of interposed entities. In addition, responsible entities have the flexibility to net applications and redemptions at the Australian unit trust level, maintain onshore liquidity reserves and potentially use distributions to provide an additional buffer against future redemption activity.
In summary, combining a portfolio of direct loans with an average three-year maturity profile and packaging in a fund structure with monthly or quarterly liquidity, creates an embedded asset/liability mismatch, which is widely recognised and forms part of the ‘illiquidity premia’ that investors receive. The current media reporting around redemptions and gating risk highlights the importance of investor education, the need to ensure that these funds should be used with a minimum five-year investment horizon, and recognition that access to capital is limited.