While Australian equities have experienced some turbulence over the past two years, the initial public offering (IPO) pipeline has continued to present managers with a vast array of opportunities.
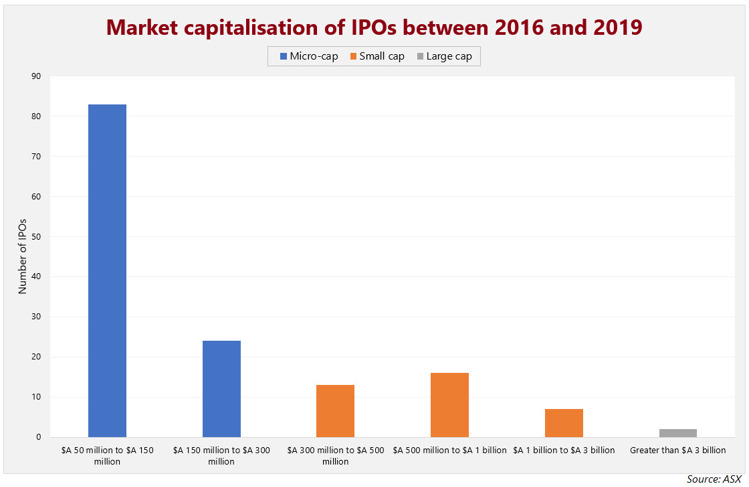
Although there are several reasons why IPOs are undertaken, the most common rationale is to raise capital for future growth. As a result, many of the companies involved in IPOs are generally faster growing and are often in the small and micro-cap universe. This is highlighted in the chart below which shows the market capitalisation breakdown of Australian companies that floated between January 2016 and December 2019. Given the liquidity considerations of our managers, we have excluded IPOs from companies that had market capitalisations of less than $A 50 million.
How have IPOs historically performed?
We found that from 2016 the median IPO outperformed the market until the 29th day following its float, before materially underperforming the market in the following 51 days.
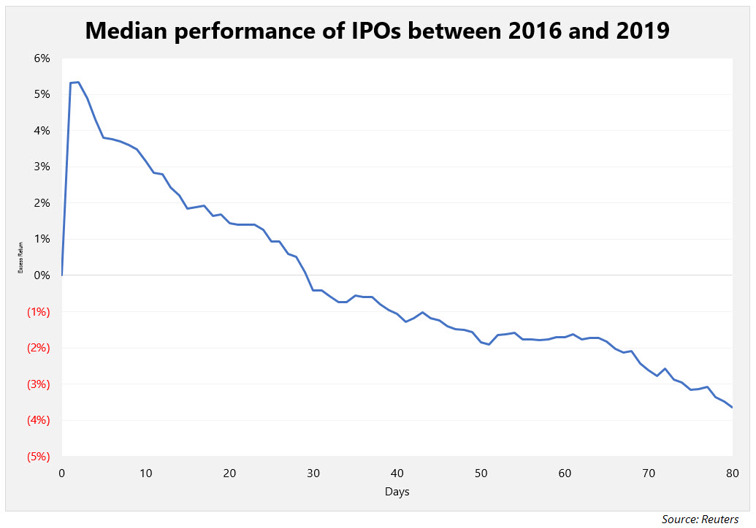
The chart suggests that the excess returns generated from IPOs are skewed towards the first few days after listing.
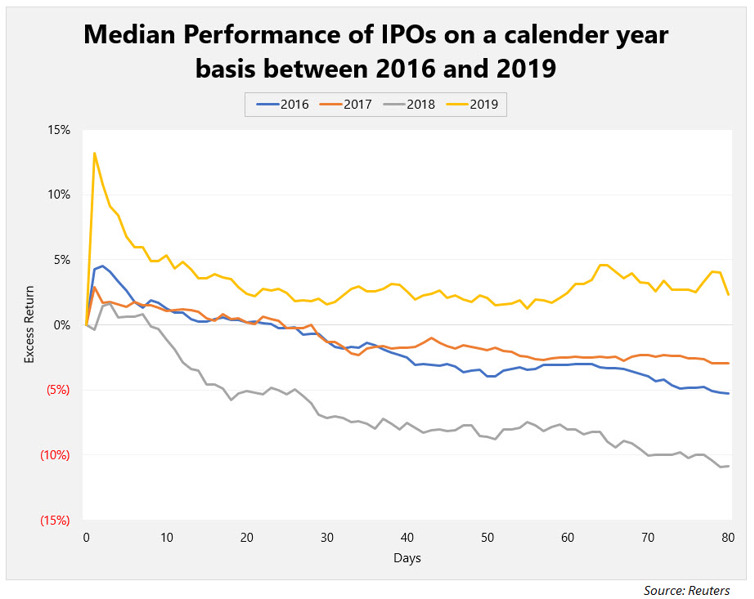
How did the IPOs in 2019 fare relative to previous years?
Whilst many investors may have expected IPOs in 2019 to perform poorly given the loss of market sentiment following the drawdown in the fourth quarter of 2018, the chart below illustrates that the excess returns of IPOs in 2019 dwarfed those of previous years.
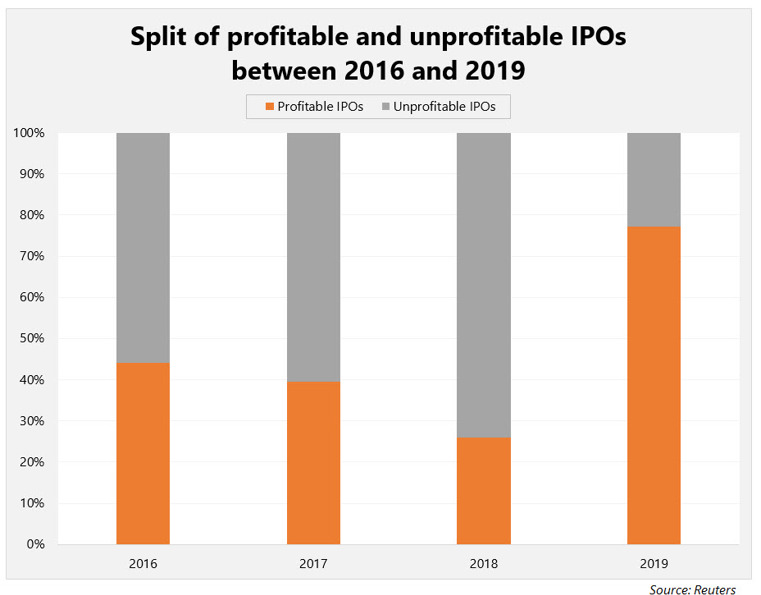
Interestingly, between 2016 and 2018 more IPOs underperformed the market than outperformed over the 80-day period after listing. However, in 2019 this trend reversed with nearly 80% outperforming.
How have our active managers fared in the IPO market in 2019?
In 2019, our average rated micro-cap fund participated in six IPOs and our average small-cap fund participated in just one. Given that only six of the IPOs in 2019 were above a $A 500 million market capitalisation, it is not unexpected that our small cap funds were less active last year. As such, we have conducted the performance analysis below on our micro-cap universe.
We compared an equally-weighted portfolio of all the IPOs greater than $A 50 million and an equally-weighted portfolio of all of the IPOs in which our fund managers participated. In line with our earlier analysis, the performance is assessed over an 80-day timeframe.
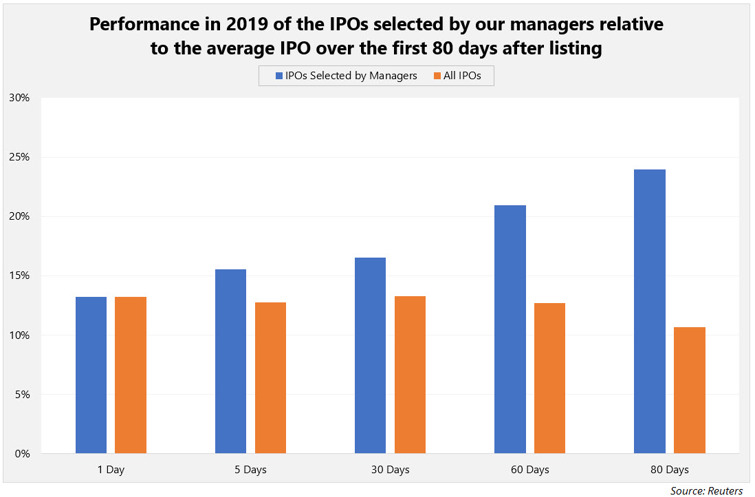
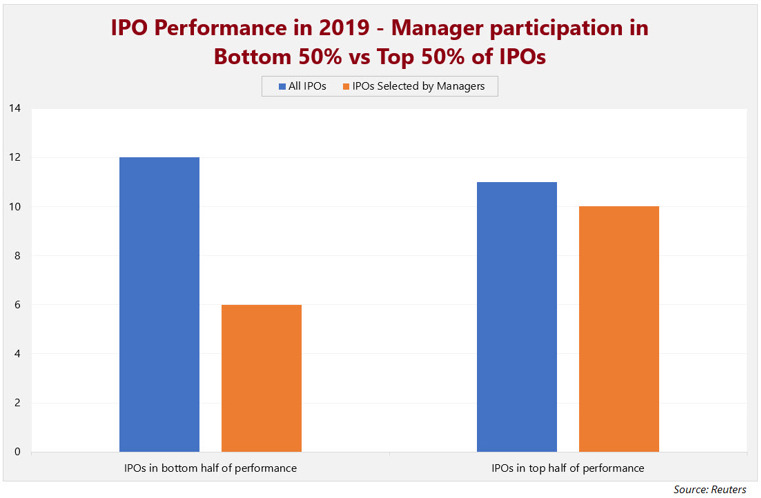
As the chart above demonstrates, our active micro-cap managers have added value above simply participating in every single IPO on offer. In addition, we note that the IPOs our managers have participated in continued to outperform the market as time goes on whilst the average IPO underperforms the longer the time horizon is extended. We believe this result is indicative of our managers’ ability to select high quality opportunities that possess sustainable outperformance. Additionally, our managers participated in a far smaller proportion of the bottom performing IPOs, relative to the top performing ones.
Whilst returns through IPOs can be extraordinary over a short time period, the potential for extraordinary returns does not come without risk. We believe that this creates opportunities for active managers, who typically add value by avoiding low quality IPOs. Overall, we expect IPOs to remain an area where an active approach provides a key competitive edge.