With the sell-off in domestic fixed interest markets over the past seven months, the sea of red ink was a painful reminder of the risks of investing in bonds. The -11% drawdown in the Bloomberg AusBond Composite Bond index from its peak in October 2021 has only been matched by the 1994 calamity, where bonds lost approximately 8% over a 10-month period.
Following the rout and if history serves as a guide, we believe that the worst of the pain might be already behind us. With the steepening of yield curves, there may be an opportunity to build some attractive yields into client portfolios.
Background
Since the Global Financial Crisis (GFC), bond yields have structurally declined across developed markets. Investors required less compensation for assuming inflation risk, and other market forces, such as QE programs, the search for yield, ageing demographics, poor productivity and various effects of globalisation created a downward pressure on bond yields.
In Australia, 10-Year Government Bond yields reached their lowest point in the third quarter of 2020 at approximately 0.8%, as they tracked broader movements in global bond markets.
At the same time, the Federal Government embarked on a large issuance program through COVID-19, with the Commonwealth Government Securities (CGS) growing to approximately $A840 billion (including Treasury Indexed Bonds) by the end of March 2022.
The growth outstripped the other sectors in the domestic bond market, as the Government component increased in relative importance, contributing to a significant duration lengthening of the Bloomberg AusBond Composite Index. The following chart highlights the relationship between the modified duration and yield-to-maturity (YTM) of the benchmark.

Source: Bloomberg
The confluence of the benchmark’s duration risk almost doubling and the YTM compressing from above 6% to below 1% created an inevitable scenario for investors, where the asset class had lost its yield cushion and were fully exposed to future inflation shocks and interest rate rises.
The magnification of risk is captured in the below chart, where we illustrate how many 0.25% interest rate hikes were required. This is based on the prevailing modified duration of the benchmark (and assuming a parallel shift in the yield curve), before the YTM of the Bloomberg AusBond Composite Index was exceeded and capital losses were borne by investors. Note, the below analysis does not seek to capture the tendency of yields to incorporate forward-looking information and increase prior to actual interest rate rises.
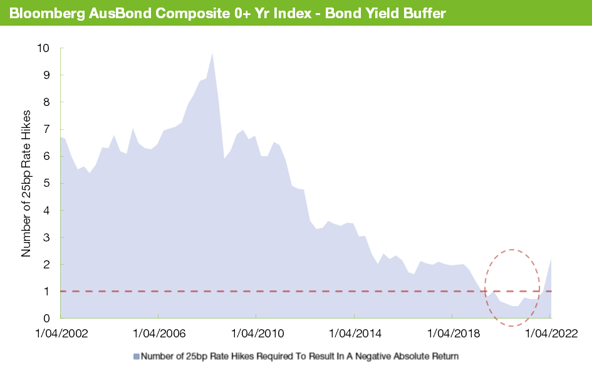
Source: Bloomberg, Zenith Investment Partners
The yield cushion of the AFI benchmark had declined over the past decade to a point where in late 2020, the benchmark couldn’t absorb a 25-basis point interest rate hike (or change in expectations), before offsetting the prevailing YTM of the benchmark and triggering capital losses. Hence, we can’t really be surprised that we subsequently experienced such a large drawdown once the inflationary environment changed and yields increased.
The road ahead for bonds
The recent sell-off in Government Bonds has resulted in the Australian 10-year Government Bond yield rising from approximately 1.68% at the start of 2022 to 3.55% in early May. The inflection point was the March quarter CPI release, which showed that year-on-year inflation was running at 5.1% (or 3.7% on a trimmed mean basis).
Against this backdrop, the market priced in a cash rate of 2.65% by December 2022, increasing to 3.23% in May 2023. If the market is correct in terms of its forecasts, the RBA has some heavy lifting to do over the next six months, while trying to navigate a finely balanced economy.
Moving through the hiking cycle and the impact on bond prices
If the market is not overly hawkish in terms of its expectations for interest rate hikes and we move into a sustained hiking cycle, the potential impact on domestic bond markets is likely to be driven by market sentiment. This would in turn highlight the RBA’s effectiveness in providing forward guidance on the direction of future policy.
What we do know is that when the RBA implements interest rate rises, Government Bond curves tend to flatten, or in other words, long-end bond yields rise less than the actual rate increases. Intuitively, the market looks through the hiking cycle and focuses on the impact of the rate rises on economic growth, inflation, wages and the implications for future cash rate settings.
In the following chart, we plot the movements in the 10-year Government Bond yield through RBA hiking periods for the period beginning January 1988 to the end of April 2022.
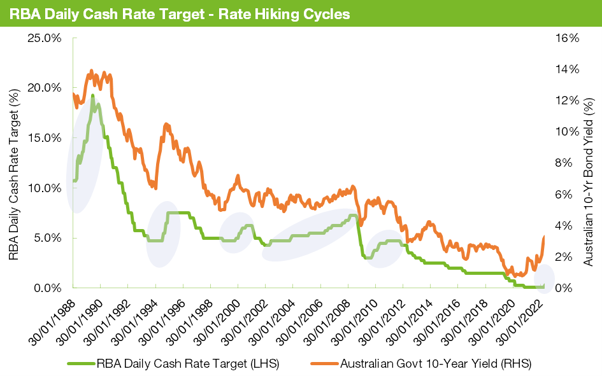
Source – RBA, Bloomberg
Over the period, 10-year Government Bond yields were relatively immune from changes in the cash rate, particularly since the 2000s. Moreover, yield curves flattened in each of the hiking periods as the market typically assessed the longer-term, macroeconomic impact of such interest rate rises.
The pace and magnitude of the RBA’s approach to returning monetary policy to a neutral setting will ultimately determine the level and path of bond yields. Typically, hiking cycles impact front end rates, while global factors (most notably movements in US Treasuries) influence longer dated bond yields. Long bond yields have typically peaked when the central banks reach neutral and often before the eventual peak in the cash rate.
At Zenith, we continue to use nominal GDP trend growth as an anchor for bond yields, which currently sits at around 4%. Since the GFC, bond yields have traded below nominal GDP growth, being influenced by the same forces that have driven down shorter-term rates detailed earlier.
The following chart highlights the close relationship between 10-year Government Bond yields and nominal GDP growth, defined as trailing 10-year average GDP growth.
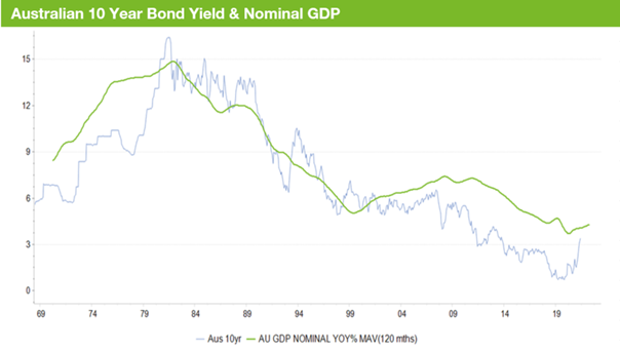
Source – RBA, using proxy updates
A normalisation of bond markets could potentially see bond yields closer to nominal GDP growth rates, which is around 4%. However, the path of interest rates won’t be linear and should provide attractive opportunities for active management.
As we move further into the RBA’s hiking cycle, we believe that most of the pain is behind us and future rate hikes should have a moderate impact on bond portfolios, assuming the RBA is effective in providing forward guidance. Importantly, with the recent spike in bond yields, managers have been able to build valuable yield buffers into their portfolios, which should provide some positive real returns over the medium term and protection in the event of further inflation spikes.